
What did they know and when did they know it?
On Dec. 1, I posted my first story about demand for AI going flat across all observed LLMs on both web and apps — including, but not limited to, ChatGPT, Claude (Anthropic), Llama (Meta), and Perplexity.
But at that time, my dataset only went back to August 1.
Now I have data that shows demand didn’t go flat in August. It went flat in spring 2025 — several months earlier.
And yet, across three consecutive quarters of SEC filings — April, July and October — companies with massive, material investments in AI never once disclosed that the demand curve had stalled.
Not in the April 10-Qs.
Not in the July 10-Qs.
Not even in the October 10-Qs, by which time the plateau had been visible externally for more than six months.
This is not a trivial omission.
This is a structural silence that spanned nine months.
What makes it even more striking is that these companies have access to far deeper telemetry than anything available to the public:
- real-time daily active users
- query volume
- churn
- model invocation frequency
- GPU capacity utilization
- enterprise trial conversions
- abandoned queries
- cost-per-inference
- internal rescoring and synthetic traffic patterns
This is the kind of visibility only platform owners have.
They knew.
And still, none of the three reporting cycles mentioned a slowdown
Instead, the disclosures went the opposite direction:
- “AI is positively impacting every part of the business.”
- “Strong customer demand for AI services.”
- “Cloud and AI strength drives results.”
- “Capital expenditures will increase to support AI growth.”
These statements were made after demand had already flattened — a fact that third-party measurement tools could see by summer, and internal dashboards would have revealed in the spring.
Which leads to the unavoidable question:
What did they know, and when did they know it?
Because it is not credible — or even possible — that companies operating massive AI platforms somehow missed the inflection point in their own usage curves. These systems do not operate in the dark. Google and Microsoft monitor everything. It’s their business.
Investors were told the opposite of the underlying reality:
- Demand plateaued.
- The curve broke.
- The exponential era ended.
- And disclosures did not change.
The silence continued through:
- Q1 filings in April
- Q2 filings in July
- Q3 filings in October
Nine months of flat demand.
Nine months of upbeat messaging.
Nine months of rising capex justified by “strong AI growth.”
Revealing the meaning in the chart, below.

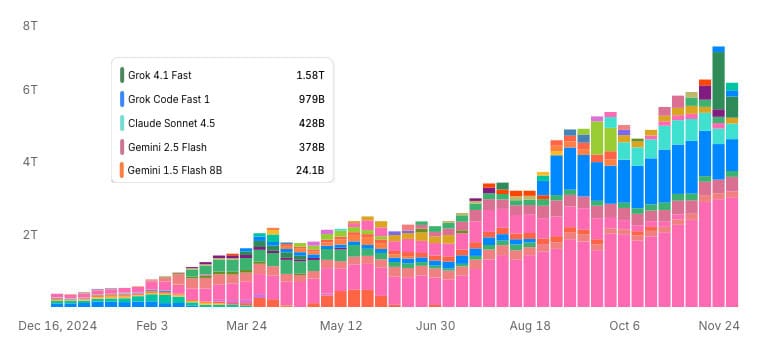
Take a look at this chart from OpenRouter. Click or tap for the interactive version. It shows token usage, which is a reasonable proxy for activity: more tokens generally means more usage.
At first glance, the chart looks like a simple growth story. The total height of the bars increases month over month, which suggests rising demand for LLMs overall.
Now here’s the key point many may miss unless it’s spelled out:
Growth is not coming from increased usage of individual models. It’s coming from new models being added to the stack.
To see this, you have to follow the colors.
Start with the dark blue bars, which represent Grok Code Fast 1. Grok doesn’t appear in any meaningful way until late summer. Once it does appear, the height of the dark blue segment stays roughly the same — and in some weeks actually gets smaller. That tells you something important: there’s no sustained growth in Grok usage after launch.
Now look at the small rose-colored bars, which represent Google’s Gemini 2.5 Flash. It first appears on July 14, but remains relatively the same week after week.
Next, look at the aqua bars, which represent Claude Sonnet. Claude Sonnet doesn’t show up until October. When it does, the pattern is familiar: an initial presence, followed by flat or declining usage from October into November. Again, no compounding growth after launch.
This same pattern repeats across other late-arriving models. They enter the chart, add to the total height of the bars, but their individual segments don’t expand over time.
So yes — total LLM usage is rising when you stack everything together.
But when you break it down by model color by color, the story changes. The apparent growth is driven by more models being introduced, not by increasing demand for any single model.
Taken together, the chart strongly suggests that usage within individual LLMs has been flat since at least Spring 2025, even as the overall ecosystem continues to add new entrants and generate noise.
The larger issue: Material omission
This is not about accusing anyone of lying.
It’s about the gap between internal truth and external disclosure.
If a company is investing tens of billions of dollars into a technology whose public demand curve has stalled, that is material information. Investors rely on timely disclosure to calibrate risk. Instead, they were given confidence-language and capex acceleration.
So the pattern is now clear:
- Demand flattened in spring.
- Public data saw it by summer.
- October filings still said nothing.
- Investors were left pricing a growth curve that no longer existed.
This is exactly how mispricings form.
And mispricings always correct.
Which brings us back to the only question that matters: