
For December and all of 2025, traffic and downloads are falling or flat for ChatGPT, Gemini, Claude, LLaMA, Grok

These charts show no significant growth from left edge to right edge:
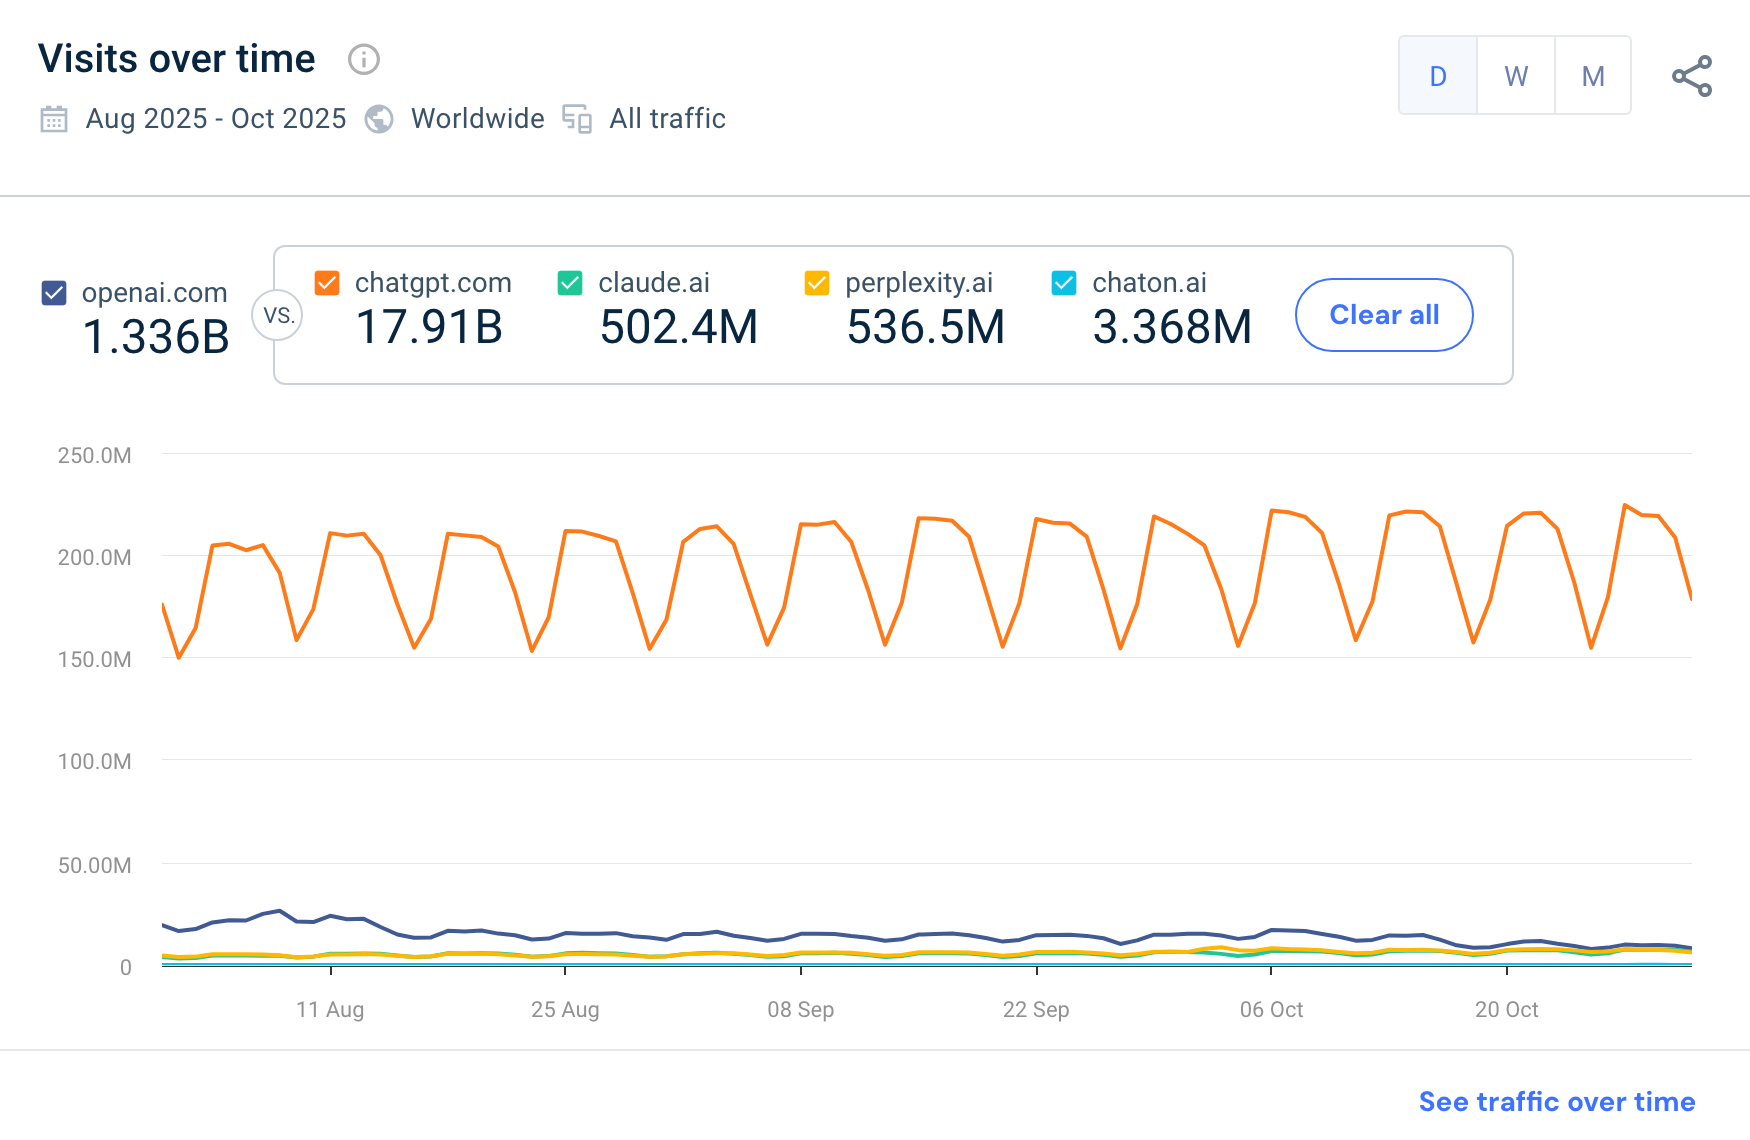
Web traffic, August - October 2025
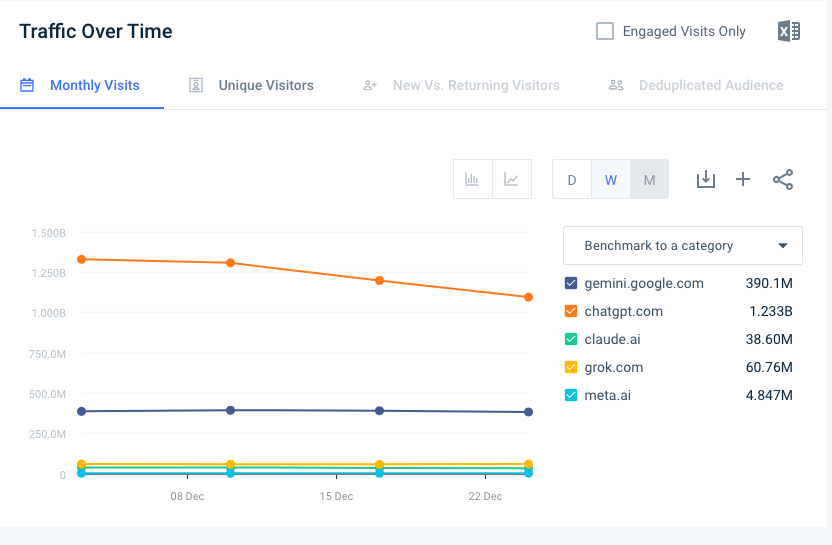
Web traffic, December 2025
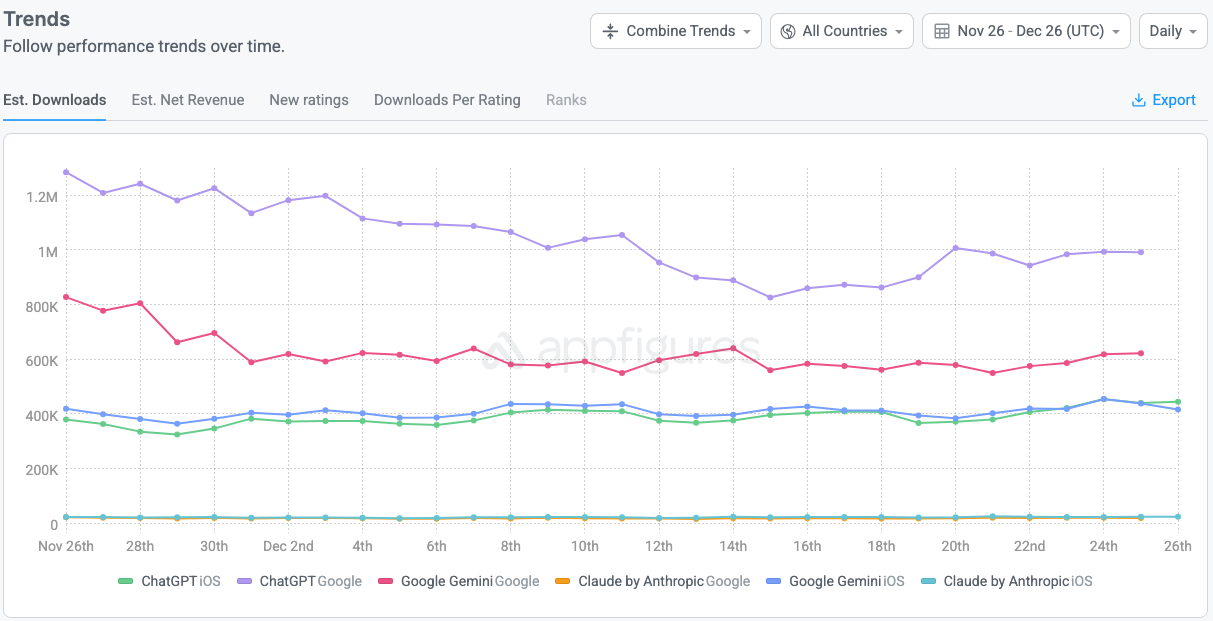
App downloads November 26-December 27, 2025
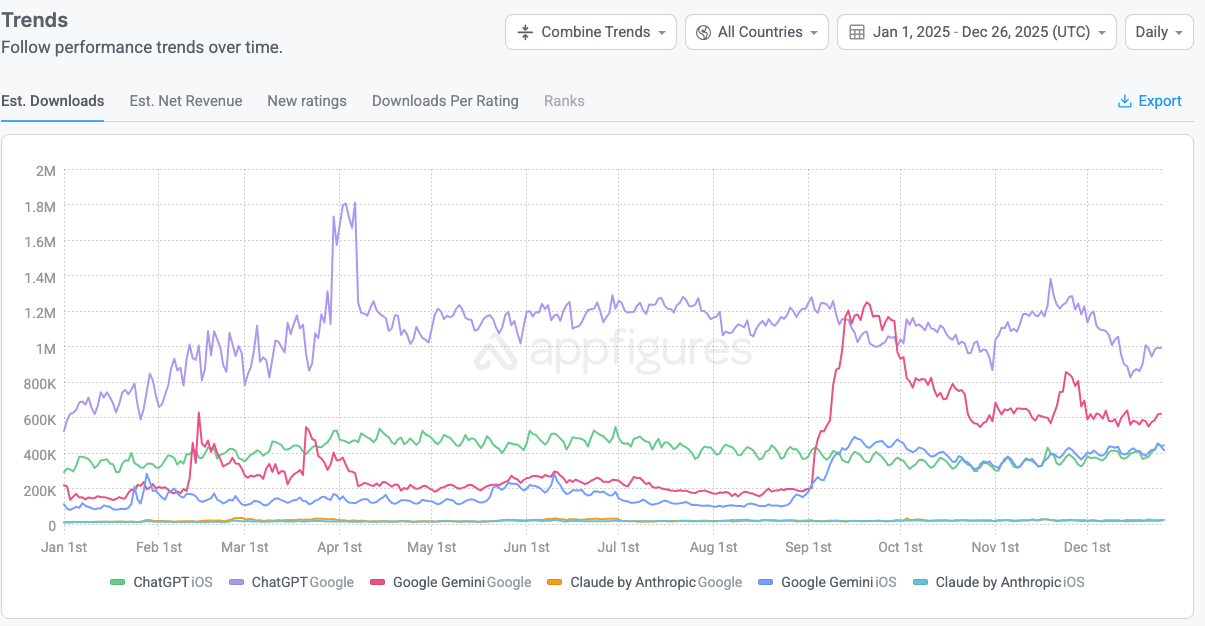
App downloads 2025
Month-over-month, November–December 2025
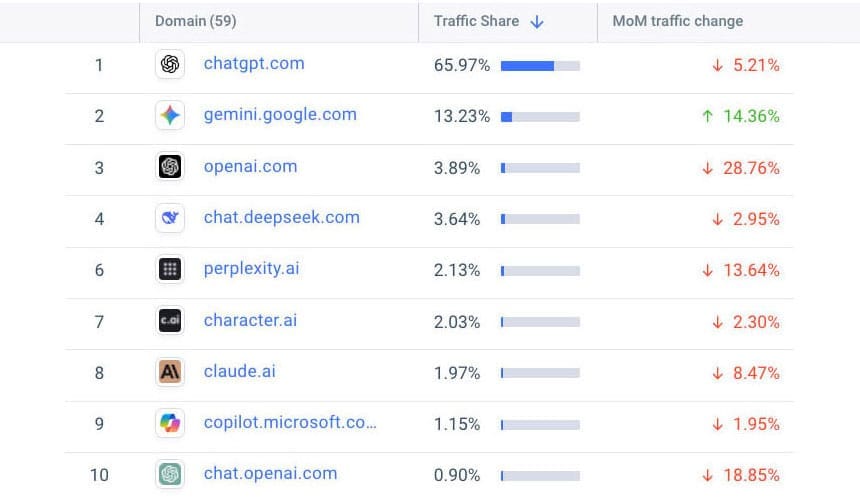
Every LLM is in the red execept for Google’s Gemini. Why?
- Gemini had been dormant for months, prior to its relaunch on Nov. 18. So any use at all puts it in the green.
- Gemini 3 is the best model – even OpenAI’s Sam Altman admits it. So by that measure alone, Gemini should be killing it.
- Google touches more people, each day, than any platform on Earth. Google has added a “Gemini” button to search – pushing it in an way that no other LLM can.
Put all three together and the question isn’t “Why is Gemini green?” but “Why isn’t Gemini greener?”
This data is inconclusive. Adoption takes time, and this data is for Nov–Dec 2025 only. Adoption cannot be measured by initial use based on mere hype and curiosity.
But Goolge has a soft and vulnerable underbelly: an 88% hallucination rate. Once users stop using Gemini for movie recommendations, hamburger recipes and settling bar bets, and start using Gemini for higher-level reasoning, they will find that Gemini always answers authoritatively but not always accurately.
Then users will discover that Gemini is just like every other LLM: untrustworthy. And just like every other LLM, Gemini’s adoption rate will go flat.
December 16, 2024 – November 24, 2025
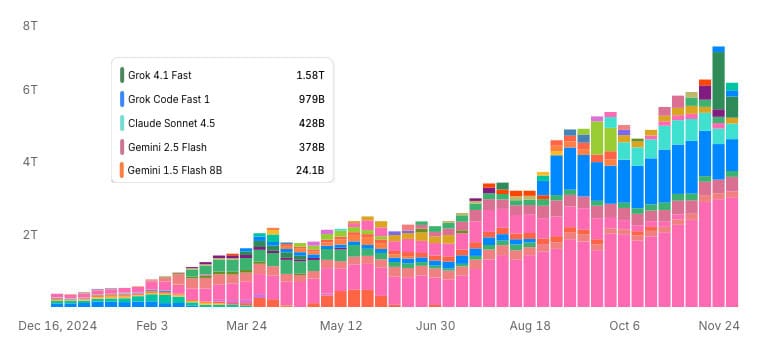
Take a look at this chart from OpenRouter. Click or tap for the interactive version. It shows token usage, which is a reasonable proxy for activity: more tokens generally means more usage.
At first glance, the chart looks like a simple growth story. The total height of the bars increases month over month, which suggests rising demand for LLMs overall.
Now here’s the key point many may miss unless it’s spelled out:
Growth is not coming from increased usage of individual models. It’s coming from new models being added to the stack.
To see this, you have to follow the colors.
Start with the dark blue bars, which represent Grok Code Fast 1. Grok doesn’t appear in any meaningful way until late summer. Once it does appear, the height of the dark blue segment stays roughly the same — and in some weeks actually gets smaller. That tells you something important: there’s no sustained growth in Grok usage after launch.
Now look at the small rose-colored bars, which represent Google’s Gemini 2.5 Flash. It first appears on July 14, but remains relatively the same week after week.
Next, look at the aqua bars, which represent Claude Sonnet. Claude Sonnet doesn’t show up until October. When it does, the pattern is familiar: an initial presence, followed by flat or declining usage from October into November. Again, no compounding growth after launch.
This same pattern repeats across other late-arriving models. They enter the chart, add to the total height of the bars, but their individual segments don’t expand over time.
So yes — total LLM usage is rising when you stack all LLMs on top of each other.
But when you break it down by model color by color, the story changes. The apparent growth is driven by more models being introduced, not by increasing demand for any single model.
Taken together, the chart strongly suggests that usage within individual LLMs has been flat since at least Spring 2025, even as the overall ecosystem continues to add new entrants and generate noise.
See related data-driven stories which track this trend back to Spring 2025:
Is this criminal? LLM adoption is flat. 10-Qs don't mention it.
Seeing Red: Everyone is down but Google. Is brute force the only way to get people to use AI?'
Users do not trust LLMs. The data tells the story.
Web + App data show AI adoption rate flat Aug-Nov
What did they know and when did they know it?